How Long Does the Power Actually Stay Out Where You Live?
Figures last verified
The average American household loses power for somewhere between two hours and thirty-one hours a year, depending entirely on which state it sits in. That range is not a guess. Every electric utility in the country reports its outage performance annually to the federal government, the data is public, and almost nobody in the preparedness world reads it.
This page is what that data says, why the number varies so enormously, and what it means for how much backup you actually need.
The metric utilities report
Since 2013 the Energy Information Administration has collected reliability statistics from electric distribution utilities through Form EIA-861, which serves roughly 145 million customers across nearly 3,000 distribution systems.
The headline figure is SAIDI, the System Average Interruption Duration Index. It measures the total time an average customer spends without power over a year, counting any interruption lasting more than five minutes. Lower is better. It is reported in minutes.
Its companion is SAIFI, the System Average Interruption Frequency Index, which counts how many separate interruptions the average customer experiences. And CAIDI, the Customer Average Interruption Duration Index, measures how long each one lasts.
Those three are related in a way that matters for planning. A state can have a bad SAIDI because outages are frequent, or because they are long, or both, and the two situations call for different preparation. California and Michigan have historically scored poorly on duration rather than frequency, meaning fewer but longer events. Louisiana and Mississippi have run the other way.
One caveat before the numbers. Reliability reporting within EIA-861 is voluntary, and while most large utilities file, some smaller municipals and cooperatives do not report every year. The picture is close to complete rather than complete.
The finding that reframes everything
Utilities report two versions of every figure: with major events included, and with them excluded. A major event is a hurricane, an ice storm, a wildfire, a derecho, or any period the utility can demonstrate falls far outside its five-year normal.
The gap between those two numbers is the single most useful thing in the dataset.
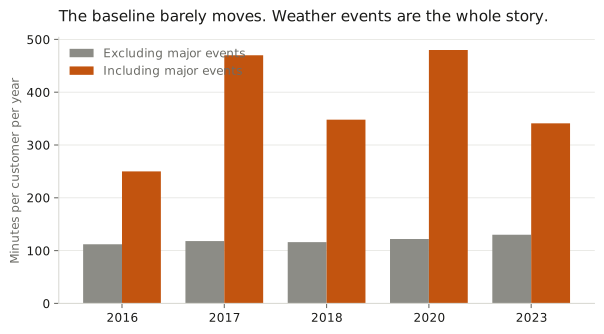
Excluding major events, the average American customer has consistently lost power for about two hours a year. That figure has barely moved in a decade, sitting between roughly 106 and 130 minutes across every year of collection.
Including major events, the same figure has swung between roughly four hours and eight hours, and the movement is almost entirely driven by how bad that year's weather was. In 2017, when hurricanes, wildfires and severe storms clustered, the with-events figure was roughly double the previous year's.
That tells you something specific and actionable. Ordinary grid reliability is stable and unremarkable. Your realistic exposure to a long outage is not a function of how good your utility is. It is a function of how much extreme weather your region gets.
Which means the right question is not "is my grid reliable." It is "what weather do I get, and what does it do to lines."
The spread between states is enormous
The national average conceals a range of more than twenty-five to one.
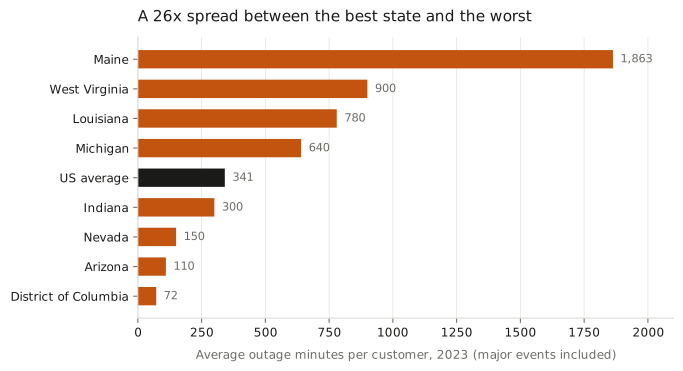
In 2023 the average American customer went roughly 341 minutes without power. The typical customer in the District of Columbia experienced about 72 minutes. In Maine, the figure exceeded 1,860 minutes, which is more than thirty-one hours.
Maine is instructive because the reason is not mysterious. It is heavily forested, it gets ice storms, and falling limbs take down distribution lines. The state has appeared at or near the top of this ranking in most years the data has been collected, for the same reason each time.
Earlier years show the same pattern with different names. In 2018 the range ran from about 1.5 hours in South Dakota to nearly 30 hours in North Carolina, which had been hit by two hurricanes that year. In 2016, excluding major events, the range ran from 27 minutes in Nebraska to about 6 hours in West Virginia, while Hurricane Matthew pushed South Carolina above 20 hours once major events were counted.
Three geographies account for nearly all of the high end. Hurricane coasts. Heavily forested regions with winter ice. And mountainous terrain with long, exposed distribution runs.
If you are in none of those, your realistic exposure is close to the baseline. If you are in one, the number that matters for you is the with-events figure, and it can be an order of magnitude higher.
Who your utility is changes the answer
The dataset separates utilities into three ownership types, and the ranking is consistent across years.
Customers of publicly owned utilities, meaning municipal systems, have historically experienced the shortest interruptions, around one hour a year excluding major events. Investor-owned utility customers have averaged slightly under two hours. Cooperative customers have averaged around two and a half.
That ordering holds whether or not major events are included, which suggests it reflects something structural rather than luck.
The likely explanation is service territory rather than management quality. Municipal utilities typically serve compact urban and suburban areas with short line runs and underground segments. Cooperatives were created specifically to serve sparse rural areas, where a single line may run for miles through trees to reach a handful of meters. More line per customer means more exposure per customer.
Practically: if you are on a rural cooperative, your realistic planning case is longer than the state average, and the state average already includes you.
How to look up your own number
Three ways, in increasing order of specificity.
The EIA publishes the underlying Form EIA-861 data files free, along with a reliability chapter in the Electric Power Annual. This is the authoritative source and it is a spreadsheet, so it takes some work.
Several third-party sites now expose the same data by utility and by ZIP code, which is faster if you just want your own figure. They are drawing on the same federal filings.
Your own utility frequently publishes its reliability performance in annual reports or in filings with your state's public utility commission, and the commission's own reports often provide more detail than the federal dataset, including performance by circuit or district.
Look up both versions of the number. The without-events figure tells you what a normal year looks like. The with-events figure tells you what your bad years look like, and the bad years are what you are preparing for.
What the numbers mean for backup
Translating outage minutes into equipment is where most preparedness content stops being useful, so here is the honest version.
If your state runs near the baseline, roughly two to four hours a year across one or two events, you are preparing for an evening. Flashlights, phone charging, and food that survives a few hours in a closed fridge cover essentially all of it. A portable power station in the 500 to 1,000 watt-hour range is comfortable overkill.
If your state runs in the middle, six to fifteen hours a year, you are still mostly preparing for events measured in hours, but with occasional multi-day exposure. This is where a properly sized battery or a small generator earns its cost, and where the furnace electrical problem becomes the deciding factor in winter.
If your state runs at the high end, twenty hours or more, your planning case is multi-day. That means a generator or a substantial battery bank, fuel storage, and a heat source that does not depend on the grid. The generator sizing guide works through the arithmetic of matching capacity to the loads that genuinely have to run, and the answer is usually smaller than people assume.
One thing the averages hide. These figures are annual totals divided across all customers, so a state averaging six hours might mean everyone lost power for six hours, or it might mean most people lost nothing and some people lost four days. The second distribution is far more common, particularly where major events dominate. Averages are the wrong tool for planning against tail events, and the tail is what hurts.
What this data does not tell you
SAIDI measures distribution outages, meaning the local wires between the substation and your house. That is the overwhelming majority of what people actually experience, and it is driven by trees, weather, equipment failure, and vehicles hitting poles.
It does not measure generation adequacy, which is whether there is enough power available at peak. That is a separate question with its own reporting, covered in how to read a grid reliability report, and it is the thing that produces rolling blackouts rather than local outages.
It also excludes interruptions under five minutes, which are common and mostly harmless except to sensitive electronics.
And it is historical. It tells you what happened, not what is coming. Load growth, generation retirements, and changing weather patterns are all pushing in directions the historical record does not capture.
The short version
Ordinary grid reliability has been stable for a decade at about two hours a year. Everything above that is weather, and the spread between the best and worst states exceeds twenty-five to one.
Your planning case is not the national average. It is your state's figure with major events included, adjusted upward if you are on a rural cooperative, and understood as a tail distribution rather than an average.
Look it up before you buy anything. A household in Arizona and a household in Maine are solving different problems, and the equipment that suits one is either wasted money or dangerously inadequate for the other.
Sources
- U.S. Energy Information Administration, Form EIA-861, Annual Electric Power Industry Report
- EIA, Electric Power Annual, Reliability chapter
- IEEE Standard 1366, definitions of SAIDI, SAIFI and CAIDI
Related: How to read a grid reliability report for your region covers generation adequacy, which is the other half of the picture. How to heat a house when the power is out covers the failure that turns an inconvenience into an emergency.
Last verified: July 2026