What Burglary Data Actually Says About How Homes Get Entered
Figures last verified
Most home security advice is built on a picture of a break-in that happens at night, by force, while the household sleeps.
The FBI collects data on this, and both halves of that picture are wrong. More residential burglaries happen in daylight than after dark. And nearly four in ten involve no force whatsoever, which usually means a door somebody left unlocked.
Once you look at what the numbers actually describe, the priority order for household security changes substantially, and several of the things people spend the most money on move down the list.
The scale, first, because it is not what people expect
The FBI recorded 779,542 burglaries in 2024, of which residences accounted for roughly 405,776, or about 52 percent.
That is the lowest burglary rate in the modern record, around 229 per 100,000 residents. Burglary has fallen by roughly 64 percent over two decades and by more than half since 2012. Whatever else is true about crime trends, residential burglary in the United States is at or near historic lows.
That context matters for two reasons. It should temper the urgency in most marketing on this subject. And it means the remaining burglaries are, if anything, more concentrated in specific circumstances rather than randomly distributed, which makes the pattern data more useful rather than less.
Geographic variation is enormous. In 2024 New Mexico recorded roughly 536.5 burglaries per 100,000 people, more than ten times New Hampshire's rate of 48.7. Your state matters far more than any national figure.
Nearly four in ten break-ins required no force
This is the finding that should reorder everyone's priorities.
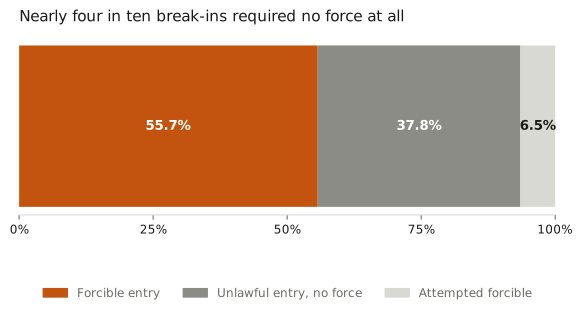
Of burglaries reported to the FBI, roughly 55.7 percent involved forcible entry, 37.8 percent were unlawful entry with no force at all, and 6.5 percent were attempted forcible entry that failed.
Unlawful entry means the burglar walked in. An unlocked front door, an open ground-floor window, an unsecured garage, a sliding door left on the latch. No tools, no noise, no broken glass, no damage.
Roughly one in every 2.6 residential burglaries in the United States is prevented by turning a deadbolt.
That is not a security product. It is a habit, it costs nothing, and it addresses a larger share of the problem than any purchase discussed in the rest of this article. The most cost-effective home security intervention available to any household is a consistent routine of locking up, including for short absences, including the garage side door, including the sliding door to the deck.
It is also the one nobody sells, which is presumably why it appears so rarely in security content.
More break-ins happen in daylight
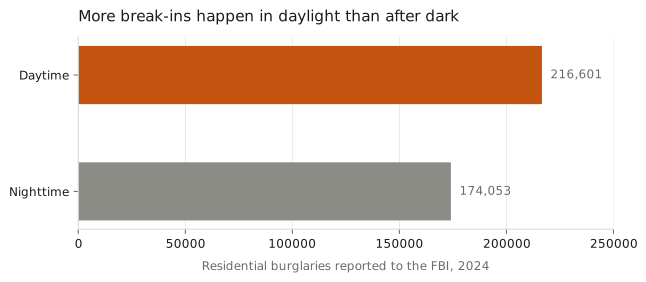
In 2024 the FBI logged 216,601 daytime residential burglaries against 174,053 at night. That is 53.4 percent in daylight and 42.9 percent after dark, and the pattern has held across multiple years of data.
The reason is simple once stated. A burglar wants an empty house, not a dark one. The hours between roughly ten in the morning and three in the afternoon are when houses are most reliably empty, because that is when people are at work and children are at school.
This has direct consequences for what actually protects a home.
Exterior lighting is genuinely useful, and it addresses under half the problem. Motion lights do nothing at two in the afternoon.
The appearance of occupancy matters more than the appearance of security during working hours. Mail and parcels not accumulating, a vehicle in the drive, sound audible from inside, blinds in a normal position rather than uniformly shut.
Alarm systems that arm only when you leave are correctly configured for this pattern, and alarm systems armed only overnight are configured for the smaller half of the risk.
And the most exposed household in this data is one where everyone leaves at eight and returns at six, in a neighbourhood where the same is true of everyone else.
The front door is the single most common entry point
Bureau of Justice Statistics data puts the front door at roughly 34 percent of entries, making it the most common single point by a clear margin.
This is where forcible entry meets a specific and cheap engineering failure. Most residential doors do not fail at the door. They fail at the strike plate, which in typical construction is fastened with two screws under an inch long, biting into soft door trim rather than into the structural framing behind it.
A kick concentrates force on those two short screws. The plate tears out of the jamb and the door swings open, undamaged.
Replacing them with three-inch screws that reach past the jamb into the stud, and fitting a heavy-gauge strike plate, costs under twenty dollars and takes about fifteen minutes. Doing the same at the hinges takes another ten. The home hardening guide covers the full sequence, but that one modification addresses the most common forced entry method at the most common entry point for the price of a takeaway meal.
Against a category where forcible entry is 55.7 percent of incidents and the front door is 34 percent of entries, twenty dollars is an unusually good return.
Duration, and what it tells you about response
Reported figures put the average break-in at roughly eight to ten minutes from entry to departure.
That number sets a hard limit on what any detection system can achieve. If your alarm notifies a monitoring centre, which contacts you, which contacts police, which dispatch a unit, the burglar is frequently gone before anyone arrives. Police clear only around 12 percent of reported burglaries, which is consistent with that timeline.
The implication is not that alarms are pointless. It is that their value is overwhelmingly in deterrence rather than in interception. Survey work in this area consistently finds that a majority of burglars would move to a different target on seeing an alarm, and that a large share check for one before attempting entry. A visible sign, a visible camera, and a visible sensor do most of the work that the monitoring subscription is credited with.
That reorders the purchase decision. The camera being seen matters more than the footage being recorded. The sign in the window is doing more than the sensor behind it.
What gets taken, and what comes back
Average loss per residential burglary ran roughly $4,986 for daytime incidents and $4,368 at night in 2024, figures which include property damage alongside stolen goods.
Recovery rates are poor for exactly the categories people care about. Cash, jewellery, small electronics and firearms recover least often, because none carry a serial identifier that survives resale. Vehicles recover comparatively well, because a VIN follows them.
Two practical consequences. Photographing and recording serial numbers for anything valuable costs an evening and materially improves the odds on the small fraction of goods that are recoverable. And a small safe bolted to structure addresses the categories that recover worst, which is a better use of a few hundred dollars than most electronics in this field.
Around three quarters of burglars reportedly head for the master bedroom first, which is where most households keep exactly those items.
The priority order the data supports
Working from the numbers rather than from the product catalogue, the ranking looks like this.
Lock things, consistently. Addresses 37.8 percent of the problem. Costs nothing. Nobody does it reliably.
Reinforce the front door frame. Twenty dollars, fifteen minutes, addresses the most common forced entry at the most common entry point.
Make the house look occupied during working hours. Free. Addresses the larger half of the time distribution, which most people's security posture ignores.
Visible deterrent signage and a visible camera. The seeing is most of the value.
Secure the garage. The side door and the emergency release cord are both common bypasses, and the garage is frequently the least hardened door on a property.
Small safe, bolted down, for the categories that never come back.
Then, if you want it, monitored alarm and recorded video. These are documentation and response tools. They sit below the items above because the eight-to-ten minute window limits what response can achieve.
Everything in the first three costs under twenty dollars combined and addresses a majority of the incident data. That ordering is unusual in this industry precisely because most of it cannot be sold to you.
What the data does not settle
Reported burglary is not all burglary. Incidents with no insurance claim and no loss frequently go unreported, so the true count is higher than the recorded one.
The FBI's national figures also aggregate an enormous range of local conditions. A national rate at historic lows is compatible with a specific neighbourhood having a serious problem, and your local police department's crime mapping is a far better guide to your actual exposure than any national statistic.
And these figures describe burglary, meaning entry to commit theft, typically of an unoccupied structure. Home invasion, meaning entry while occupants are present, is a different and much rarer offence with different dynamics, and the numbers here should not be read as describing it.
The short version
Residential burglary is at historic lows. When it happens, it is more likely to occur in daylight than at night, and nearly four in ten incidents involve no forced entry at all.
The interventions that match that data are locking up consistently, reinforcing the front door frame for twenty dollars, and making the house look occupied while everyone is out. All three are cheap or free, and none of them are what the security industry leads with.
Sources
- FBI Uniform Crime Reporting Program, Crime in the United States, 2024 and prior years, burglary tables
- Bureau of Justice Statistics, entry point data
- FBI arrest and clearance statistics, 2024
Related: Home hardening: what actually stops a break-in covers the physical measures in detail with a cost-ranked table. Pepper spray and less-lethal laws covers what you can legally carry and how the rules vary.
Last verified: July 2026